“Where performance is measured, performance improves. Where performance is measured and reported, the rate of improvement accelerates.” This statement is commonly called Pearson’s Law and is attributed to Karl Pearson. The words echo profoundly in the context of mobile app KPI metrics. Think of it as decoding your app’s DNA. Each KPI is a unique gene shaping success. Downloads, user engagement, and retention rates — all these metrics are vital for your app’s performance. In this post, we’ll discuss mobile app KPI metrics in detail and answer your most frequently asked questions about them.
Is your company about to launch an app? If so, you should treat the whole process as a journey split by many milestones and a hefty backpack full of survival tools. Let’s call your milestones “app KPI” and imagine carrying a backpack full of tools and knowledge on how to measure ASO! Are these words not familiar enough to you? This piece will explain what app KPIs matter the most and what your company needs to do to monitor them correctly.
After reading the guide, you will know:
- what ASO metrics and key app KPIs matter,
- how to gauge and apply them correctly.
Let’s begin by deciphering the main terms. The letters KPI mean “key performance indicators,” and ASO stands for “App Store Optimization metrics.” Getting into ASO and mobile marketing KPIs will provide you with a clear map of your app’s strong and weak sides, and show you which marketing buttons need to be pressed regardless of your app goals. They can include retention improvement, organic growth, a surge of installation’s count, user cost minimization, conversion improvement, and others. Many of these metrics rely on the app’s discoverability on the app marketplaces, and this guide starts from this exact point.
Table of Contents
App Store Visibility: What Makes It Critical
Regardless of your ASO strategy, the biggest goal is to increase app visibility on the App Store and Google Play and generate more organic (aka worthy) installations. You can achieve high discoverability for your app via the featured section, search, and top charts. To measure how visible and discoverable your product is, you need to monitor KPI rankings regularly across all the countries your product is available in. The key metrics for mobile apps to monitor with your ASO toolkit include:
- Keyword rankings
The rule to remember is that the number of keywords your app can organically rank on defines how its visibility rate is. However, you can’t make this the key target of your app’s KPI. Instead, you should pay higher attention to the ranks of each specific keyword and the overall volume of all keywords.
For example, if your app uses 40 keywords for ranking and its keyword volume is equal to 70, it means that it has better app store visibility than any other app that has 150 keywords with a keyword volume of 20. — Asolytics Team
- Category rankings
Although they are not amongst critical KPIs anymore and we generally don’t count them to evaluate ASO success, they are still important indicators that can help you figure out your app’s place amongst resembling titles in the category and in which way ASO efforts and results of the top titles are ahead of yours. - Related apps
When your app appears in the “Similar” section, it serves as an extra source of organic downloads through search. You need to measure the overall number of appearances in “Similar” to see which kinds of apps and games are referring to your app and for what reason. This way, you can compare your ASO efforts with the competitors and borrow ideas that work well for similar products. - Top chart positions
Getting into app store top charts, such as “Top Free Apps,” “Top Paid Apps” or “Grossing” is an achievement on its own. However, you also need to measure how the keyword metrics change when you make it to the top charts. Besides, you have to track the surge in user reviews, and, most importantly, the surge in conversion rate. You can easily monitor app usage statistics using third-party tools you like the most. - Visibility is “Featured”
When your app makes it to the app store home page, it’s another huge KPI that requires monitoring similar to when your app gets to the “Top” section. We prepared an article, “Get Your App Featured by Apple App Store” to show you how to get make it to the most downloaded apps list. - Visibility score
This KPI for app marketing is valuable in terms of competition and shows how visible your product is compared to similar apps and games in the niche. Visibility score involves the number and volume of keywords your rank app on.
- Keyword impact
This metric shows how many organic downloads your app gains on particular keywords after a recent app metadata update. It can help you eventually achieve a higher concentration of valuable keywords and boost the average number of installs. Don’t forget that you can use the Asolytics keyword tool for profound keyword-based analysis of your app and its competitors.

To collect keywords, use the Recommended tool in Asolytics
Conversion Rate: How to Measure It
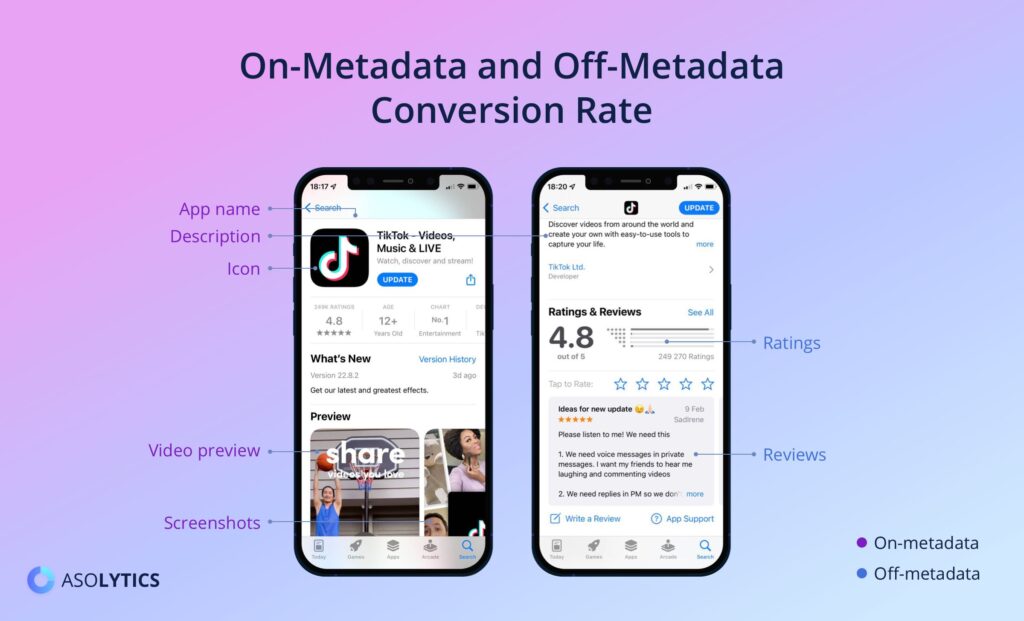
Conversion rate is the second biggest goal that is affected by several ASO metrics and can be split into two main categories:
- On-metadata – this includes an icon, app description, video preview, app name, and screenshots.
- Off-metadata – this includes reviews, user ratings, and the number of downloads.
Proper adaptation of such app elements as icons and previews can attract many users. That’s why it is important to test icons before launching the app. After the app is in the store, you should monitor reviews and work with them. All of these steps can increase app conversion rate of your app.

The KPIs for the conversion funnel efficiency measurement include:
- TTR (tap-through rate, same as click-through rate) – this KPI measures the fraction of users who tapped the icon of your app to see the product page. The quality of the icon and title affect this metric the most.
- CR (conversion rate to install) – this reflects the percentage of users who decided to download the app after viewing the product page.
Proper optimization of TTR and CR is crucial for your app’s conversion funnel efficiency. These two metrics translate into the number of users who get interested in your app by the product page and end up downloading the product.
But how to improve them? That’s where A/B testing comes in handy. Using ASO A/B testing tools, you can conduct experiments to compare how two different approaches perform. You need to change one element of the product page at a time to clearly identify its impact and prevent ASO cannibalization. For the best results, paid user acquisition is recommended.
User Feedback: The Impact of Ratings and Reviews
The next important step to measure mobile app performance is to analyze user feedback quality as it has a huge impact on attracting more users. In terms of ASO, user reviews and ratings play a huge role in how app store algorithms treat your app and affect conversion rates by influencing user decisions to download your app.
User sentiment has a direct impact on the visibility score and conversion, so it’s very important to work on it, gaining as many positive ratings and reviews as possible to avoid a decrease in conversion. Never leave the reviews unanswered, as a good reply can not only encourage a user to use your app more but also change their mind and improve the rating. Fortunately, both Google Play and the App Store let you do this.
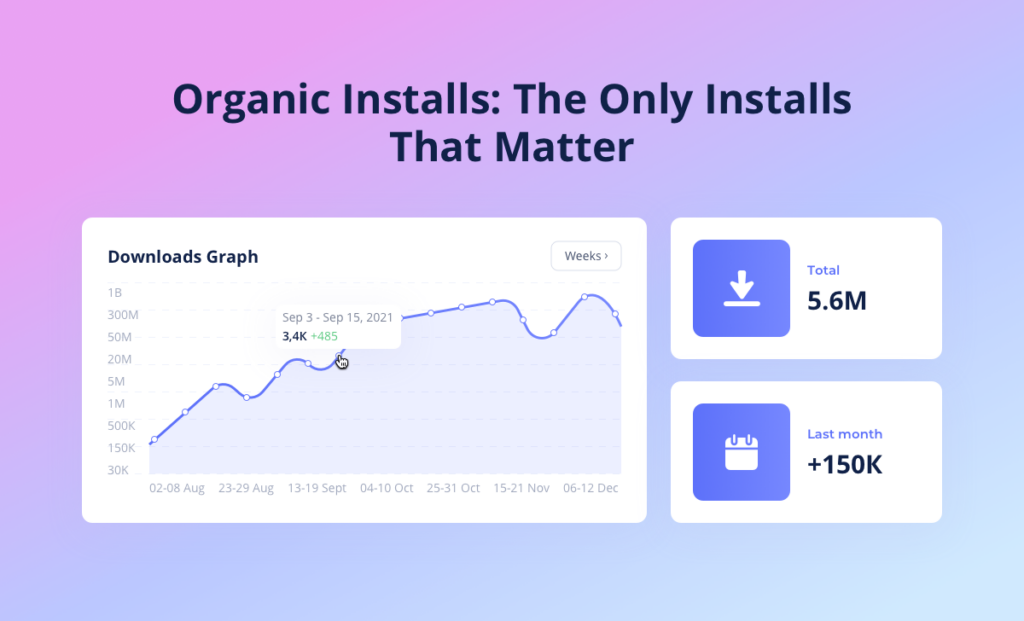
Organic Installs: The Only Installs That Matter
For most marketers, the number of organic installs is one of the most important apps and mobile game KPIs as it allows them to measure the return of ASO objectively. However, both Google Play and the App Store don’t make it easy to measure organic installs. For example, the App Store combines organic search downloads and Apple Search Ads in the solo “Search” source, and Google started to do the same after the introduction of its refreshed console design.

This being said, you should remember that the increase of organic downloads doesn’t necessarily relate to the ASO and SEO efforts of your team but can also indicate successful acquisition campaigns on social media or elsewhere. To split the factors more effectively, you need to launch ASO activities apart from advertising improvements or major app updates. Besides, it will be helpful to split creative and keyword updates to measure each of them more precisely.
Monetization: Last but Not Least
The last and perhaps the most valuable of mobile apps and mobile games KPIs is monetization because it indicates the amount of revenue your project receives. This includes three major items to measure:
- LTV (Lifetime Value) – a forecast of app profits per user in the future.
- ARPU (Average Revenue per User) – latest revenue figure divided by the current number of active users.
- Revenue – the full amount of money generated by your app.
Don’t forget that the quality of each user is much more important than the overall number of users (aka installs). A user who keeps paying for the subscription and views more ads is many times more important than the one who tries and leaves in a few minutes. That’s why we recommend watching how the most active users behave in your app and product page and analyzing what they think about your product via comments rather than pursuing a larger number of monthly downloads. Use the Asolytics pro features for that precious in-depth analysis that will help you take your app to a brand new level.
Mobile App KPIs Beyond Metrics: Exploring Uncharted Territories
When it comes to app stats, some crucial bits fly under the radar. Naturally, we are obsessed with downloads, how many people enjoy your application, its stickiness, and those fancy ASO stats. But there’s a treasure trove hiding in the shadows. Below, we’ll let you in on those undercover, yet super important, unmeasured elements that play a huge role in your app success. Also, we’ll provide tips on how to work on each of them to skyrocket your product to stardom:
- User experience
- Session Length & Frequency. Check how long users stick around and how often they come back.
- App Responsiveness. Make sure your app works in a gracefully smooth way — no hiccups, no glitches.
- User Flow Analysis. Follow users’ footsteps, find spots causing frustration.
- App stability and performance
- Crash Rates. Keep tabs on hiccups to prevent them from ruining the fun for your audience.
- App Size & Resource Usage. Watch the app’s diet — how much space and power it slurps.
- Feature adoption & usage
- Yay or Nay. Figure out which features get the spotlight and which ones fade into the background.
- Spring Cleaning. Tidy up or toss features no one’s into.
- Response time & feedback incorporation
- Speedy Reaction. Check how fast you swoop in to rescue user queries.
- User Voices Matter. See how well user ideas make it to your application.
Conclusion
Now you can clearly see that there’s no solo metric that can answer how successful your product actually is. It’s a big bunch of KPIs that can also affect each other dynamically. That’s why you have to move from measuring the specific indicators to painting the general ASO portrait of your app or game. Don’t underestimate the power of data and don’t forget to follow the “divide and conquer” rule while making any ASO updates. It means that you have to change only one element at a time and separate any ASO efforts from exterior advertising and social media marketing efforts. To accurately gauge the effectiveness of your app store optimization efforts, it’s crucial to familiarize yourself with key ASO vocabulary such as conversion rate, keyword ranking, and user retention.
You also have to be as realistic as you can while setting ASO goals and invest enough time and effort into developing and implementing a marketing strategy. Don’t be afraid to experiment with approaches and pay close attention to how well the product functions. There’s no good ASO without a good product, but a good product won’t shoot without high-quality ASO as well!


